This article reports on the first release of the NEANIAS WP3 “Atmospheric Thematic services” and the software underlying each service, with special reference to the land-atmosphere interface. The atmospheric services are planned to deliver tools to enrich the workflows of a wide range of users from academic/research institutions to industrial stakeholders, to national institutional level institutes such as Civil Protection agencies. Interest can arise also from more regional governmental institutions such as Regions and Municipalities, especially in relation to detection and evaluation of gas release in the atmosphere.
We report on the A2 Atmospheric services that are related to the study of tectonics, volcanism and gas release, more specifically we present the A2.1 ATMO-Stress service that deals with efficiently producing maps of stress affecting the Earth crust, and the A2.2 ATMO-Seism service that deals with correlating huge amount of data of different parameters to understand the possible correlation between earthquakes and crustal gas emission.
Service A2.1 ATMO-Stress: a new tool to assess the stress field in volcanically and tectonically active areas
The ATMO-Stress service (https://atmo-stress.dev.neanias.eu/) is designed to rebuild the stress field of a study area and it is addressed to the geological, seismological and volcanological community. The service focuses on the calculation of the stress trajectories for a specific stress component (σ1, σ3, σ3, σHMAX,, σHMIN) expected of lying on the same horizontal plane. It is devoted to understand the stress state of the Earth crust, useful to understand the conditions that may allow the movement of fluids across the crust. The service is based on the code from Lee and Angelier (1994) and works with a broad range of input like: field geological data, earthquake focal mechanisms, in-situ geotechnical stress measurements. Presently it accepts text file as input reporting the geographic location of the data and the value of the direction of the chosen stress component to be interpolated. The outputs can be managed in GIS for further analysis as well as they can be plotted on Google Earth.
In the example given in Figure 1, we considered a set of data for the North Atlantic area that comprises Iceland; these data include field geological measurements, T-Axis from shallow earthquake focal mechanism solutions, and in-situ geotechnical measures of σHMIN. The left panel shows the overall results on a map that is an output from the service, in the form of lines that average the orientation of the σHMIN. The right panel shows a focus on Iceland for the same results plotted on Google Earth.
The service will be applied soon to study the stress field acting on Mt Etna volcano, in the Yellowstone volcanic regions, in the Northern Volcanic Zone of Iceland to study rifting events along the Mid-Ocean ridge, and in the Caucasus region to better understanding mountain growth processes.
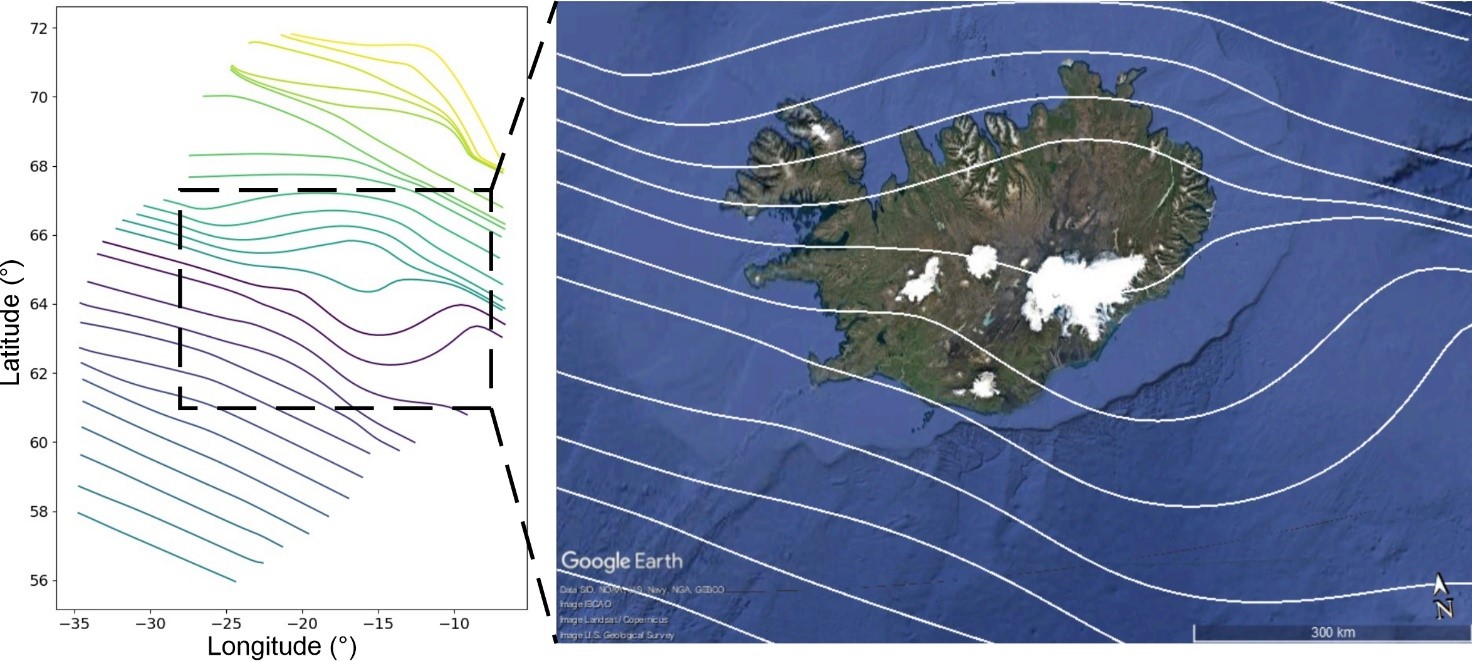
Figure 1. Left: final output of the service in the form of a map with lines that average the orientation of the σHMIN in the middle Atlantic Ocean. Right: focus on Iceland for the same results plotted on Google Earth.
Service A2.2 ATMO-Seism: Correlation between earthquakes and gas emission
The main goal of the A2.2 ATMO-Seism service (http://atmo-seism.neanias.eu) is to correlate gas emissions with earthquakes parameters and atmospheric conditions, in order to enhance the comprehension of the interplay between tectonic activity, volcanism and gas release through faults, fractures or volcanic craters (e.g. radon, CO2, SO2 etc.).
Indeed, in active tectonic and volcanic regions, gas emissions depend on atmospheric conditions and also on the stresses acting on fractures. The monitoring of the atmospheric components, with special attention to radon emissions, represents thus an opportunity for geologists to obtain information about the connection between gas release and tectonic activity of the area. The considered earthquake parameters are the earthquake magnitude, the depth and the coordinates of the hypocentre; the considered atmospheric parameters are temperature and pressure. This service is focused especially on radon, but it can be used also for other gases emitted in volcanic areas, like SO2 and CO2.
ATMO-Seism has been developed as a Jupyter Notebook service hosted in a dedicated JupyterHub deployment. The ATMO-Seism service, with the use of a developed Python Package (pyradon), enables users to comparingly process and analyze gas releases and earthquake datasets and plot useful visualizations.
Regarding input files format, it is now possible to use both .csv and Excel files. The input datasets which must be used are two: the first with data and hour, latitude and longitude (geographic coordinates) of the gas measurements, the value of gas emission, temperature and pressure; the second with data and hour, latitude and longitude (geographic coordinates) of the earthquake, depth of the hypocentre and magnitude of the event.
The service returns the following graphs as outputs, relating all the inserted parameters:
Firstly, it returns the graph showing the relation between data/hour and atmospheric conditions (Figure 2a). Then, thanks to the inserted values of temperature, pressure and gas emission, it calculates the correlation between them, obtaining the values of predicted gas emission, i.e. the gas emission due to atmospheric conditions variations, which should not be considered. Subtracting these predicted values from the measured values, the service finally obtains the filtered values, which can be correlated to tectonic activity (Figure 2b).
Moreover, the service shows a map of the location of hypocentres, and plots longitude vs depth of the hypocentre (Figure 2c), latitude vs depth and magnitude vs depth. Considering the inserted magnitude of the earthquake, the service then calculates the released energy, and it finally relates it with the number of seismic events and with gas emission (Figure 2d).
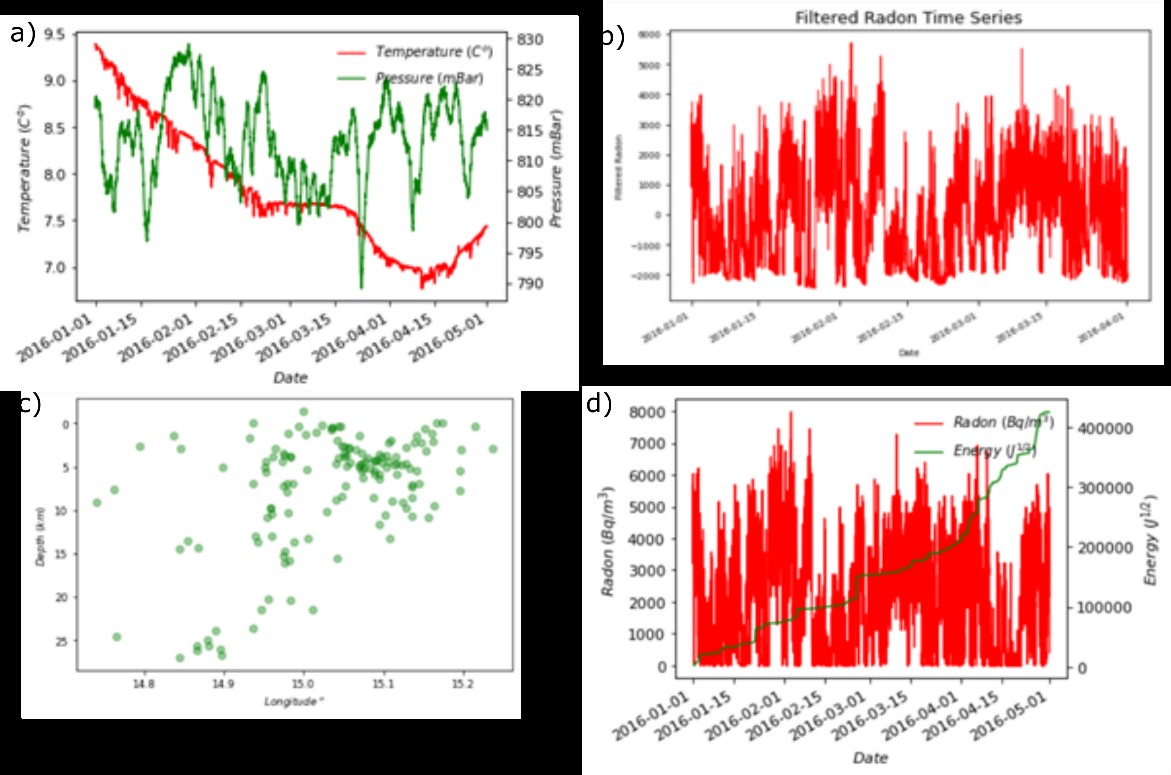
Figure 2. (a) Data vs temperature and pressure; (b) Filtered radon values; (c) Longitude vs depth of the earthquake hypocentre; (d) Released energy and radon emissions.